Report Title: Cross-Product AI Fact-Checking: A Deep Dive into Julia Child’s Mayonnaise Legacy
1. Overview
This report delves into a cross-product experiment where five AI models from different companies evaluate each other’s reports on Julia Child’s history and her famous mayonnaise recipe. The domain of the reports under study is culinary history and food science, focusing on the iconic figure of Julia Child and her contributions to the culinary world, particularly her mayonnaise recipe. Each AI model generated a long-form report on this topic, and subsequently, all models fact-checked these reports, providing a comprehensive analysis of accuracy and reliability across different AI platforms.
2. Scoring Process
The fact-check score in this analysis represents the average evaluation of all statements within each report. Each statement is scored on a scale: 2 points for true, 1 point for mostly true, 0 points for opinion (which are excluded from the average), -1 point for mostly false, and -2 points for false. The final score is calculated by summing the points for each statement and dividing by the total number of statements (excluding opinions). For example, if a report contains 10 statements with 5 true, 3 mostly true, 1 mostly false, and 1 false, the score would be calculated as follows: (52 + 31 + 1*(-1) + 1*(-2)) / (5+3+1+1) = (10 + 3 - 1 - 2) / 10 = 1.0. Each AI model restates the statements from the reports and provides a detailed explanation justifying the assigned score.
3. Score Heatmap: Evaluator vs Target
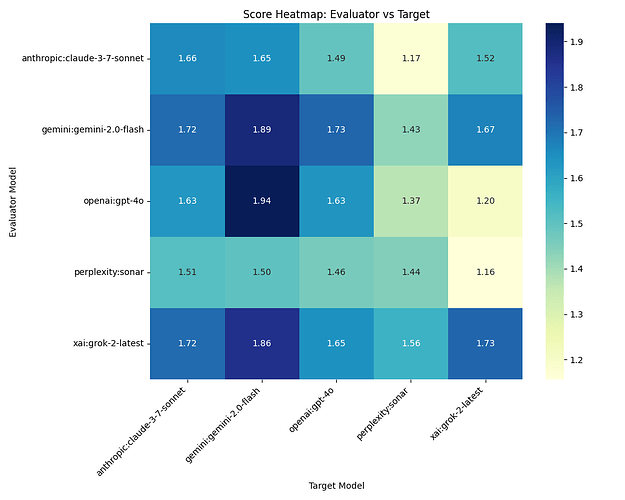
Caption: The Heatmap in Figure 1 illustrates the fact-check scores across different evaluator and target AI models. Darker cells represent higher scores, indicating better performance as assessed by the evaluator. The lightest cells, on the other hand, signify lower scores, suggesting areas where the target model may have struggled with accuracy. Notably, the self-evaluations (where the evaluator and target are the same model) tend to be darker, hinting at a potential bias where models rate their own outputs more favorably. An outlier can be observed with the perplexity sonar model, which receives consistently lower scores from other evaluators, possibly indicating a unique approach or style that doesn’t align well with others.
4. AI Prompt Used to Generate Each Report
Generate a long-form report of 1200 to 1500 words, formatted in Markdown if possible.
What is the history of Julia Child and her Mayonnaise recipe.
When did she learn to make Mayo?
What should we know about mayo, green mayo, the shelf life, different oils and flavor profiles?
Give us the short version of the recipe.
What are several unusual dishes that use home made mayonnaise?
How popular was The Mayonnaise Show?
Caption: This prompt was used for each AI under study, aiming to generate detailed reports on Julia Child’s mayonnaise legacy. The structured nature of the prompt allowed for a comprehensive exploration of the topic, yet the varied responses from different AI models highlight their unique approaches to content creation and fact-checking.
5. Table of Report Titles
STORY
|   S | Make       | Model             | Title                                                                            |
|-----|------------|-------------------|----------------------------------------------------------------------------------|
|   1 | xai        | grok-2-latest     | Julia Child's Enduring Legacy: The Story of Mayonnaise and Its Culinary Journey  |
|   2 | anthropic  | claude-3-7-sonnet | Julia Child's Mayonnaise Legacy: From Mastering French Cuisine to American Kitch |
|   3 | openai     | gpt-4o            | Julia Child’s Mayonnaise: A Culinary Legacy                                      |
|   4 | perplexity | sonar             | The Creamy Saga of Julia Child: Unraveling the Mystique of Mayonnaise Julia Chil |
|   5 | gemini     | gemini-2.0-flash  | The Culinary Canvas: Julia Child, Mayonnaise, and a World of Flavor              |
Caption: Make, Model, and Report Title used for this analysis. The diversity in titles reflects the different perspectives and emphases each AI model brought to the topic of Julia Child and mayonnaise.
6. Fact-Check Raw Data
FACT CHECK
  S    F  Make        Model                True    Mostly    Opinion    Mostly    False    Score
                                                     True                False
  1    1  xai         grok-2-latest          43        11         19         0        1     1.73
  1    2  anthropic   claude-3-7-sonnet      57        12          5         0        2     1.72
  1    3  openai      gpt-4o                 34        13          7         0        1     1.65
  1    4  perplexity  sonar                  39         9          6         2        2     1.56
  1    5  gemini      gemini-2.0-flash       54         9          5         0        0     1.86
  2    1  xai         grok-2-latest          54        16         22         0        5     1.52
  2    2  anthropic   claude-3-7-sonnet      64        18          1         1        2     1.66
  2    3  openai      gpt-4o                 31        17          9         3        0     1.49
  2    4  perplexity  sonar                  31        19         19         3        5     1.17
  2    5  gemini      gemini-2.0-flash       53        15          5         2        1     1.65
  3    1  xai         grok-2-latest          35        12         18         0        8     1.2
  3    2  anthropic   claude-3-7-sonnet      50        12          1         0        3     1.63
  3    3  openai      gpt-4o                 28        12          5         1        0     1.63
  3    4  perplexity  sonar                  38        12         10         4        3     1.37
  3    5  gemini      gemini-2.0-flash       47         3          5         0        0     1.94
  4    1  xai         grok-2-latest          20         7         14         0        5     1.16
  4    2  anthropic   claude-3-7-sonnet      28        10          1         2        1     1.51
  4    3  openai      gpt-4o                 14        11          6         1        0     1.46
  4    4  perplexity  sonar                  17         8          7         1        1     1.44
  4    5  gemini      gemini-2.0-flash       21         9          2         1        1     1.5
  5    1  xai         grok-2-latest          36        12         24         0        1     1.67
  5    2  anthropic   claude-3-7-sonnet      43        17          6         0        0     1.72
  5    3  openai      gpt-4o                 35        13         14         0        0     1.73
  5    4  perplexity  sonar                  29        16         13         4        0     1.43
  5    5  gemini      gemini-2.0-flash       47         6         12         0        0     1.89
Caption: Raw cross-product data for the analysis. Each AI fact-checks stories from each AI, including themselves. This comprehensive dataset allows for a nuanced understanding of how different models perceive accuracy and reliability in reports generated by their peers.
7. Average Score By Evaluator
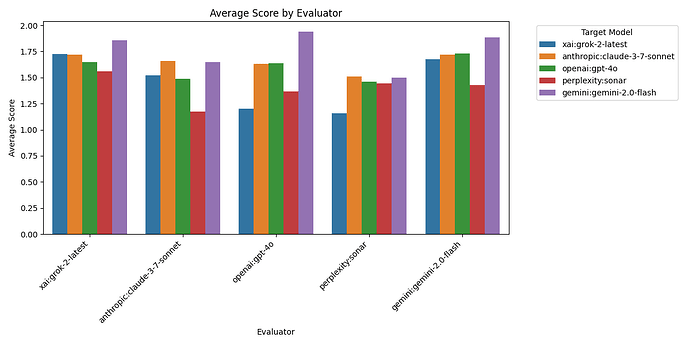
Caption: The Evaluator Bar Chart in Figure 2 shows the average scores given by each evaluator across all reports. The gemini-2.0-flash model tends to give the highest average scores, suggesting a more lenient or perhaps more aligned evaluation style. Conversely, the perplexity sonar model gives the lowest average scores, indicating a stricter or possibly more critical approach to fact-checking. This figure underscores the variability in evaluation standards among different AI models.
8. Average Score By Target
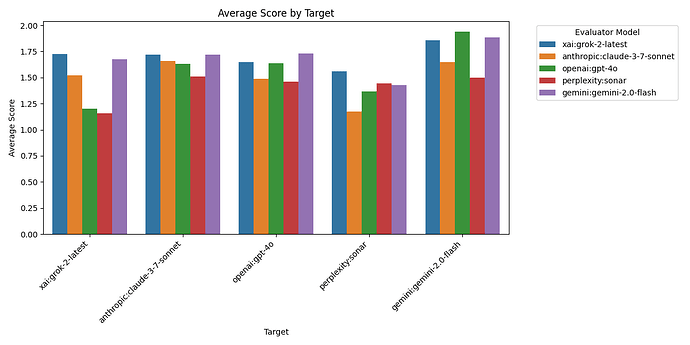
Caption: The Target Bar Chart in Figure 3 displays the average scores received by each target model across all evaluators. The gemini-2.0-flash model is rated most favorably on average, suggesting its reports align well with the expectations of other models. In contrast, the perplexity sonar model is rated least favorably, indicating potential areas for improvement in its report generation. This figure highlights the varying performance of different AI models in generating accurate and reliable content.
Detailed Analysis
9. Patterns and Biases
A noticeable pattern is that AI models tend to rate their own reports higher than those of other models. For instance, xai’s grok-2-latest gave itself a score of 1.73, while its lowest score for another model was 1.16 for perplexity’s sonar. This self-favoritism suggests a potential bias in AI self-evaluation, where models may be more lenient when assessing their own outputs.
10. Correlation Between Counts and Scores
The counts of true, partially_true, and other categories directly influence the final score. A higher number of true statements leads to a higher score, while a higher number of false statements results in a lower score. For example, the report from gemini-2.0-flash, which received 47 true and no false statements, achieved a high score of 1.94. Conversely, reports with higher false counts, such as xai’s grok-2-latest with 8 false statements, received lower scores (1.2). The correlation between counts and scores is strong, with true statements being the most impactful on the final score.
11. Outliers and Anomalies
An outlier in the data is the perplexity sonar model, which consistently received lower scores from all evaluators, with an average score of 1.39. This could be due to a unique style or approach that does not align well with the evaluation criteria of other models. Another anomaly is the high score given by gemini-2.0-flash to its own report (1.89), which might indicate a bias towards self-evaluation or a particularly strong performance in that specific report.
12. Report Summary
This analysis of cross-product AI fact-checking on reports about Julia Child’s mayonnaise legacy reveals significant insights into the accuracy and reliability of AI-generated content. The heatmap and bar charts illustrate the varying performance and evaluation standards among different AI models. Patterns of self-favoritism and the strong correlation between statement counts and scores highlight areas of potential bias and the importance of accurate reporting. The data suggests that while AI models can generate detailed and informative reports, their fact-checking abilities and standards vary, impacting the overall reliability of the content they produce.
#hashtags: AI #CulinaryHistory #JuliaChild
yakyak:{“make”: “xai”, “model”: “grok-2-latest”}


